Notes from Hyper-Dimensional Spelunking

Writing software is hard. Visualizing its behavior makes it easier.
Our current toolbox has unit tests, REPLs, static analysis, walkthrough debuggers, hot code reloading, visual programming, data flow diagrams, and more.
But we can do more. Much more.
As introduced in my previous post, I’m working on Tastes. It’s a Typescript library for intelligent sampling for use in software visualization. The idea is to show the extent of states in which a piece of code can exhibit with minimal setup from the coder.
Thinking about this has raised some interesting questions!
- If we can’t show every state, which ones do we pick?
- And how do we visualize the ones we do select?
Welcome to the world of hyper-dimensional spelunking. Grab your third-dimensional helmet and fifteen-dimensional rope.
We’re going in!
Please Hold the Rope and Take a Gander
You’re in a cave! Isn’t this exciting?
I’m glad you came with me. I told you getting away from the city for a bit would serve you well! I mean, I know I needed it. I swear to God if I had to listen to Derek’s Spotify playlist one more time through that cubicle wall… whatever let’s ju—
What was that flickering? Is that your flashlight?
That’s the only light we have!
How are we going to map the cave now?!
Kids, bring backup batteries to your hypothetical spelunking situations.
But, you didn’t — oops. So, what do you do? Where do you look with your limited light left?
It’s a problem similar to visualizing program behavior. Your flashlight becomes your program, directions become your inputs, and cave topography is your output.
You can look everywhere, but it may take a long time. What do you do when time is of the essence?
You could look randomly, but then you might miss important features. Check it out on some random mathematical function:
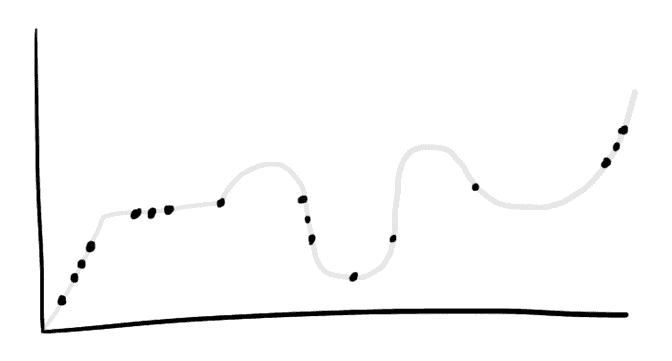
Well, if your cave happens to be a signal then you can ask some information theorists. They’re expert cave explorers, but only if it’s composed of waves.
🥁🛎
They suggest using the Nyquist-Shannon sampling theorem. The basic idea is to sample at twice the rate as the smallest possible wavelength. Otherwise you’ll never be totally sure what you’re looking at.
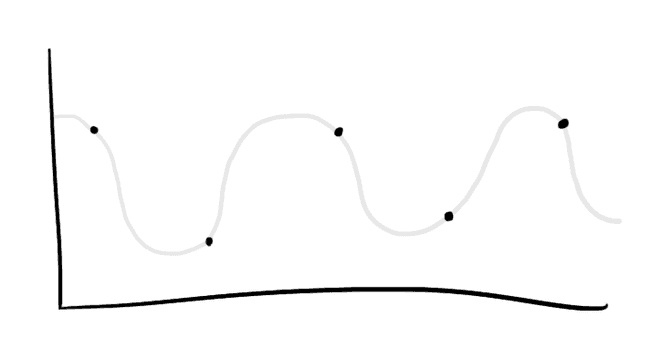
Cool. But our cave isn’t made out of waves. And it isn’t one dimensional. It’s hyper-dimensional.
Oh my.
The Curse of Dimensionality
Higher dimensions complicate things.
You thought a plain, old, third-dimensional cave is big? A fourth-dimensional cave is way bigger. A fifth-dimensional cave is way bigger, squared. A sixth-dimension cave is way bigger, cubed. And hence forth.
Sampling the space with your flashlight may seem futile. If you’re not careful, you’ll run out of power before mapping even a sliver.
This is such a problem, it turns out fellow cave explorers have even given it a name. It’s the curse of dimensionality.
Darn hyper-caves. Chill out a bit, eh?
It looks like we have to replace our low battery with some classic brainpower.
Spreading Out with Cartesian Products
A good start is to evenly spread out where you look around.
Let’s say you want to check three places along each dimension. In three dimensions, this may look like checking out every corner of an imaginary cube surrounding you and the mid-edges in between.
That list of places is a cartesian product. So for an arbitrary unit hyper-cube this product looks like:
Great, but does raise any alarm bells for you?
The curse!
Picking Favorites
Higher dimensions make the number of places — or samples — really unwieldy. Let’s try to reduce our sampling.
A good first step is prioritize locations on dimensions, then avoid the least important ones. For example, let’s check out a sample space which isn’t a cave:
In other words, we have the set of all fonts with different colors, weights, and styles. You can imagine as an example in .
Let’s say you want to see how the different fonts look in a poster you’re creating. There are a few questions to ask here:
- How many hues do we sample? There are theoretically infinite.
- Do we really care about every combination of hues, weights, and styles?
We can manage to pair down our sample set if we care less about some dimensions. You could imagine sampling a bunch of hues combined with random weights and styles. No Cartesian product! Or do the opposite: see the product of weights and styles with random hues thrown in.
The problem is since our goal is human understanding, the best sampling method is purely subjective. Any implementation would have to be making best guesses, but give the user optional configuration. This is the current approach taken in Tastes.
Don’t Touch the Space-Filling Snakes
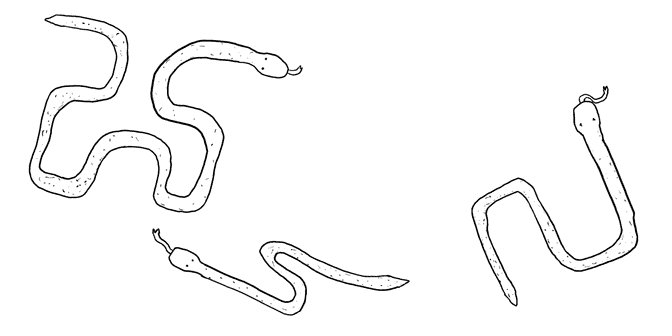
Cartesian products are simple to understand, but have some drawbacks. You can’t choose any number of samples and have them equally spread out. You’ll have to pick favorites.
Those are not issues with space-filling curves. If you’re not familiar, they are functions which project a single dimension into any hyper-dimensional space. If you draw them out they look like the most masterful game of Snake you have ever seen.
They’re neat because they preserve locality while being incredibly easy to use. Want five samples? Just pick five scalar points, and project them onto the curve. Want them equally distributed? Well, they will stay spread out after projection.
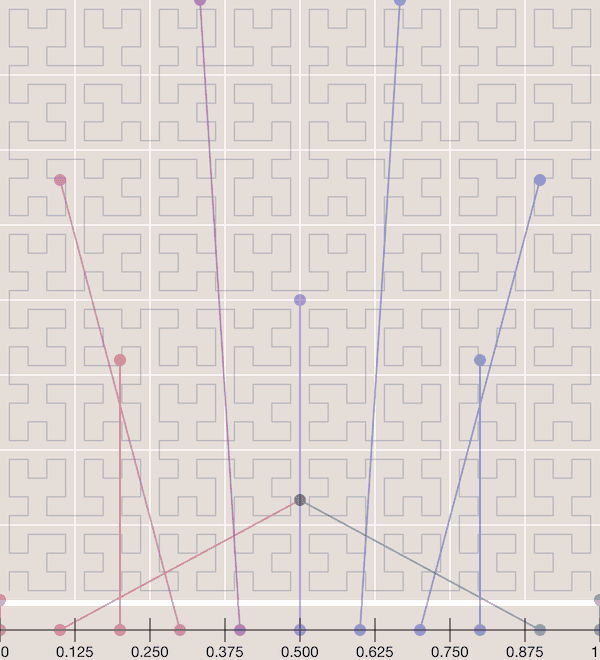
I prefer the Hilbert curve over the Z-order or Peano curves. The latter two don’t preserve locality as well as the Hilbert curve, but are much faster to compute.
Get Your Hyper-Goggles, You Fool!
So we’re getting better at point our flashlights around this hyper-cave. That’s cool, I guess.
You know what’s even cooler?
Understanding what you’re looking at. Let’s get a gander at hyper-space!
But as you might have guessed, it’s just a little difficult to understand more than three dimensions. It’ll be worth it, though. Being able to see hyper-space means we can actually intuitively explore any sample space we see fit.
Nifty.
And it turns out we do have some mathematical goggles at our disposal to do so. They project higher dimensional spaces into one, two, and three dimensions for our primitive squishy brains.
Yay, math!
So what exactly are these goggles? Well, space-filling curves yet again! We can use them in reverse to project a hyper-point onto the first dimension — a line. Then we can project that back into the second or third dimension as we like. Nifty.
This gives us the cool property where neighboring samples are alike each other. And as you go outwards, the samples predictably evolve. An example use case could be a zoomable grid of examples. Or a yes-or-no prompt which refines your browsing as it does a binary search on the one-dimensional line.
You can see some neat visual applications of space filling curves for binary data visualizations and a map of the internet.

But space-filling curves aren’t the only game in town. Our new hyper-goggles could also be made out of a dimensionality reduction process.
One example is t-SNE, which has been popular in the machine learning world. It’s mainly used to peer into the learnings of a deep-neural net by examining how it groups items in a data set. Of course t-SNE isn’t alone with other methods like UMAP being developed as well.
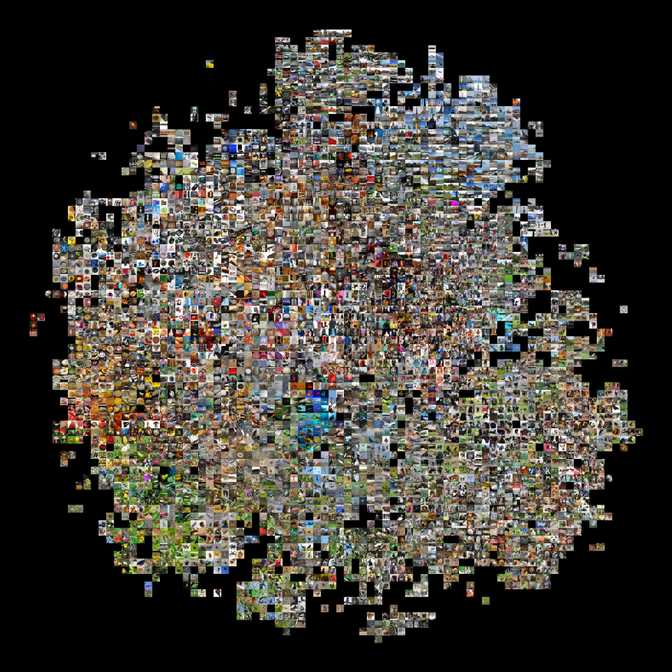
Now imagine this being used to visualize sample spaces in terms of clusters. I’ll admit, it’s a little of stretch. I’m not quite sure how performant these methods are or if they support live additions of the datasets.
Endless Caves
If this tickles your fancy, feel free checkout Tastes or just get in touch! I’ll be thinking about this stuff as I expand out the capabilities of Tastes for my own work.
Happy spelunking!
PS. Just remember your flashlight batteries and hyper-goggles.